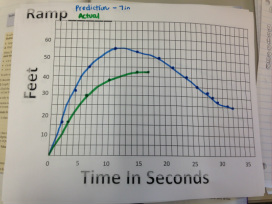
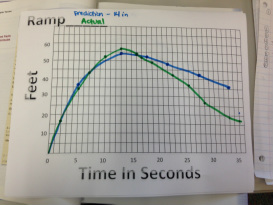
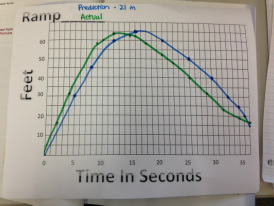
-My predictions were very close for 21 inches and 14 inches, but not very close for the 7 inch ramp. My 7 inch graph was so different because I thought the skateboard would go further in the same amount of time, but it didn't. My initial reasoning for the shape of these graphs was that I thought the incline would be fast and the decline would be slightly slower.
-The zeroes of my graph represented the start and end points.
-The three graphs were different when talking about zeroes, maximums, and minimums. The maximums got lower with each graph, and the minimums got higher. The first zero was 0 for each one because that's where it started. The last zero was different for each one because each trial ended at a different point.
-The slope is highest for the 21 inch ramp because the ramp was tallest, and therefore gave the skateboard the most speed. The slope of the 14 inch ramp was slightly lower seems the ramp was also lower. The slope for the 7 inch ramp was the lowest of the three because the height was the lowest, giving the skateboard less speed. It's rising the fastest from 0-10/15 seconds and falling from 10/15-17/35 seconds.
  |
 RSS Feed