- Explain in words what each of the graphs below would mean.
- Which graph shows this situation most realistically? Explain.
- Which graph is the least realistic? Explain.
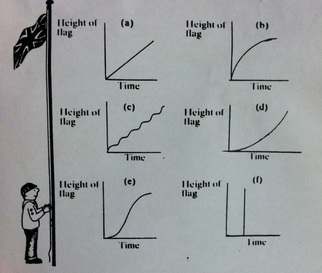
Graph (A) would mean that he is raising the flag at a consistent speed, not speeding up or slowing down. Graph (B) would mean that he started out raising it fast, but then slowed down at the end, almost plateauing. Graph (C) would mean that he is constantly speeding up and slowing down, speeding up and slowing down, but at the same rate. Graph (D) would mean that he starts out slow, and then speeds up at the end. Graph (E) would mean that he starts slow, increases speed very quickly, and then slows down at the end. Graph (F) would (be nearly impossibly) mean the he raises the flag the height of the whole pole instantly.
I think that Graph (D) shows the most realistic situation because I think you would start out slow, then speed up when you get the hang of it.
I think that Graph (F) shows the most unrealistic situation because it is impossible to raise the flag instantly without any time passing.
 RSS Feed